
Personal Research · Exploratory Work
Portfolio Analytics
A Methodology Case Study
Disclosure
This page documents a personal research project in quantitative portfolio analytics. Dr. Vardavas is not a financial adviser. Nothing on this page constitutes investment advice, a solicitation, or a recommendation to buy or sell any security. All backtesting results are in-sample and do not guarantee future performance. This work is shared as a demonstration of applied mathematical modeling methodology.
The Problem: Regime-Conditional Asset Rotation
Most portfolio frameworks choose between two extremes: passive buy-and-hold (which exposes investors to full drawdowns during crises) or active market timing (which is psychologically demanding and typically executed poorly). This project occupies a middle ground: a rules-based regime rotation framework that dynamically allocates across equities, precious metals, Bitcoin, and cash in response to changing macroeconomic and market-stress conditions.
The core insight is that different assets tend to outperform in different macroeconomic environments — and that these environments can be detected systematically using quantitative signals rather than discretionary judgment. The framework's job is to detect which regime is current and rotate the portfolio toward the assets best suited to that environment. No individual asset price predictions are involved.
A behavioral stability constraint is built into the design: the strategy must be one an investor can actually follow through adverse periods. This motivates optimizing log-utility (which directly penalizes variance through the compounding mathematics) rather than the Sharpe ratio, and applying a fractional Kelly position-sizing layer with circuit breakers that enforce a near-cash posture when rolling drawdown crosses defined thresholds.
Mathematical Tools
The pipeline is structured as seven sequential modules covering macro context assessment, regime classification, gold market scoring, allocation, and position sizing. The key mathematical constructs are:
Regime Classification
Two-dimensional volatility quadrant spanned by VIX (equity implied volatility) and VXSLV (silver implied volatility), yielding four actionable regimes: risk-on, gold hedge, broad stress, and systemic crisis.
Log-Utility Optimization
Calibration objective is the expected log-portfolio growth rate 𝒰 = μ·T − ½σ²·T, which maximizes long-run compounded wealth. The σ² penalty is a mathematical fact of compounding, not a preference.
Kelly Criterion & EWMA Sizing
Fractional Kelly position sizing with RiskMetrics EWMA variance estimation (λ = 0.94), so exposure contracts automatically after volatility spikes and expands as realized volatility subsides.
Cross-Asset Macro Signals
Gold-Oil Ratio (GOR), Gold-Silver Ratio (GSR), CAPE, Buffett Indicator, M2 growth, yield curve, and rolling cross-asset correlations encode macroeconomic regime and relative demand information.
Backtested Performance: 2015–2026
The backtest covers January 2015 to April 2026 — eleven years spanning a full range of macroeconomic environments including the 2020 COVID crash, the 2022 rate-hike cycle, and the 2024–2026 gold bull market. All parameters were calibrated on this same sample (in-sample results). Backtesting assumptions include conservative round-trip transaction costs and no look-ahead bias.
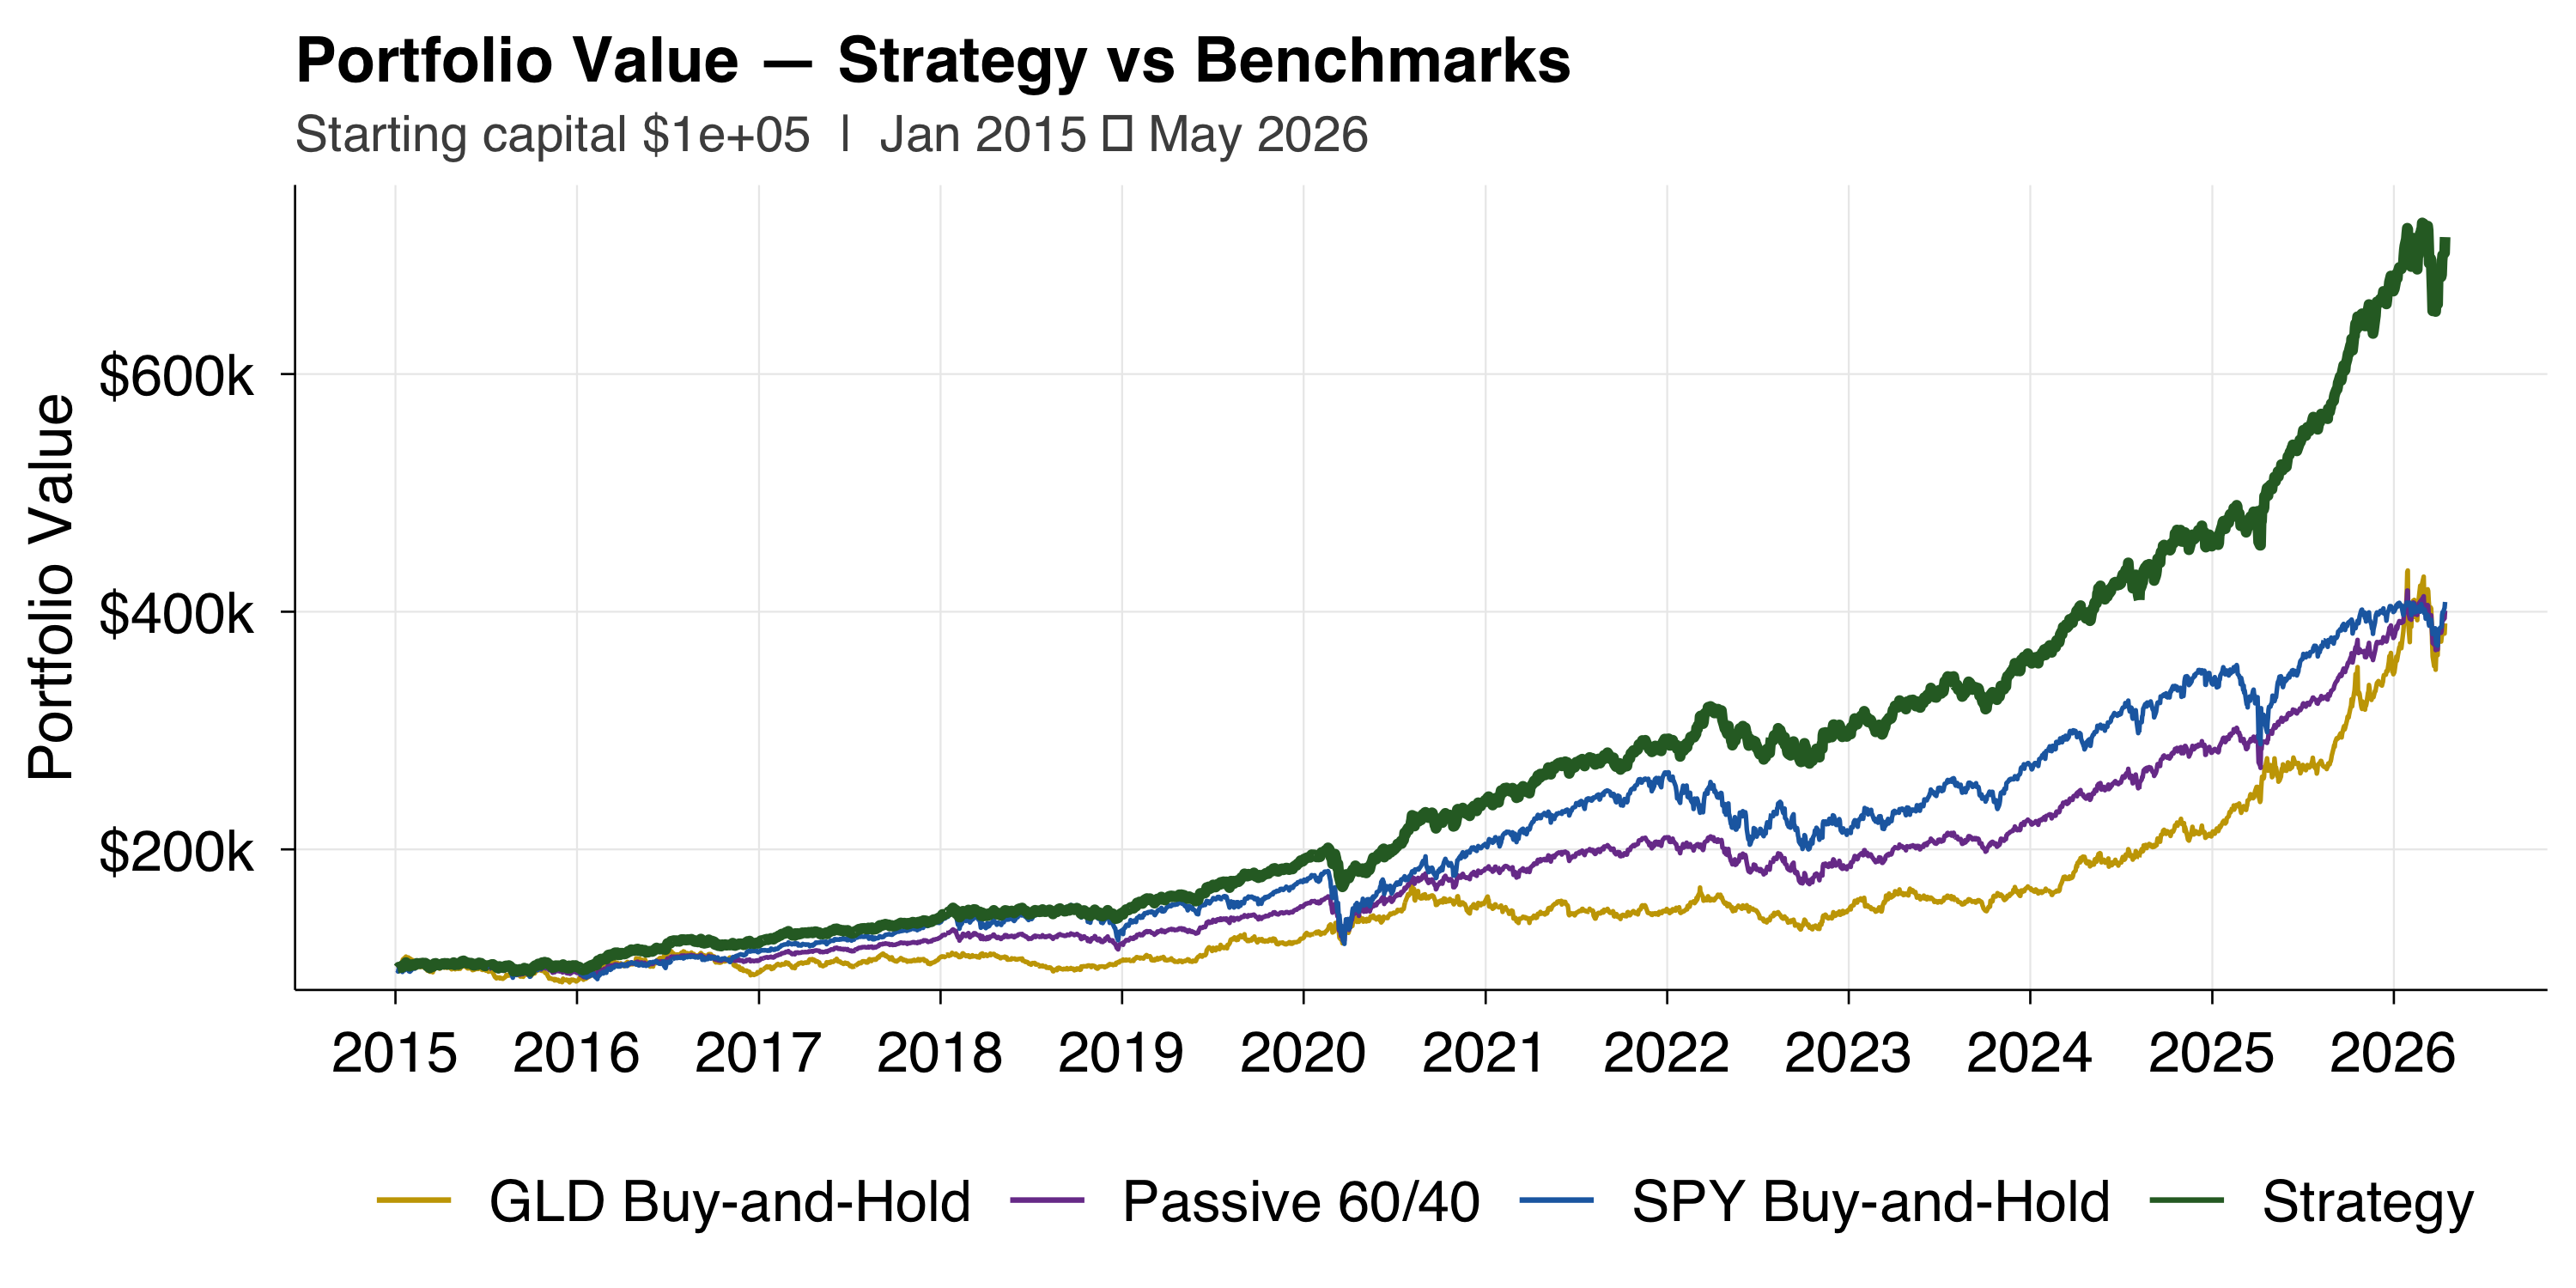
| CAGR | Volatility | Sharpe | Max Drawdown | Calmar | |
|---|---|---|---|---|---|
| Strategy | 19.1% | 14.2% | 1.12 | −16.3% | 1.17 |
| S&P 500 (SPY) | 13.3% | 18.4% | 0.48 | −33.7% | 0.39 |
| Gold (GLD) | 9.6% | 15.8% | 0.47 | −21.2% | 0.45 |
All metrics annualized. Backtesting period: January 2015 – April 2026. In-sample results only.
The strategy achieves higher returns than both benchmarks with lower volatility and a substantially shallower maximum drawdown — a combination that is only possible through effective regime detection. The Calmar ratio (return per unit of worst-case loss) is 1.17 for the strategy, compared to 0.39 for SPY and 0.45 for gold. A $100,000 investment in 2015 compounds to approximately $659,000 in the strategy, versus $382,000 for SPY and $278,000 for passive gold.
Methodological note. Proprietary content — including specific parameter values, calibration thresholds, allocation weights, and source code — is not disclosed here. This page describes the framework at a level sufficient to assess the soundness of the approach and the mathematical tools used. All backtested results are in-sample and reflect calibration on the same data used for evaluation. Past performance does not predict future results. Dr. Vardavas is not a financial adviser, and nothing herein constitutes investment advice.
Dr. Vardavas's engagement with quantitative finance goes back to the early 2000s, when he co-founded Quantnotes.com — a freely accessible finance education resource that reached ~7,000 weekly sessions at its peak. The articles are preserved as a historical archive. Read the Quantnotes history →